A threshold says it broke. An objective says how much you can afford.
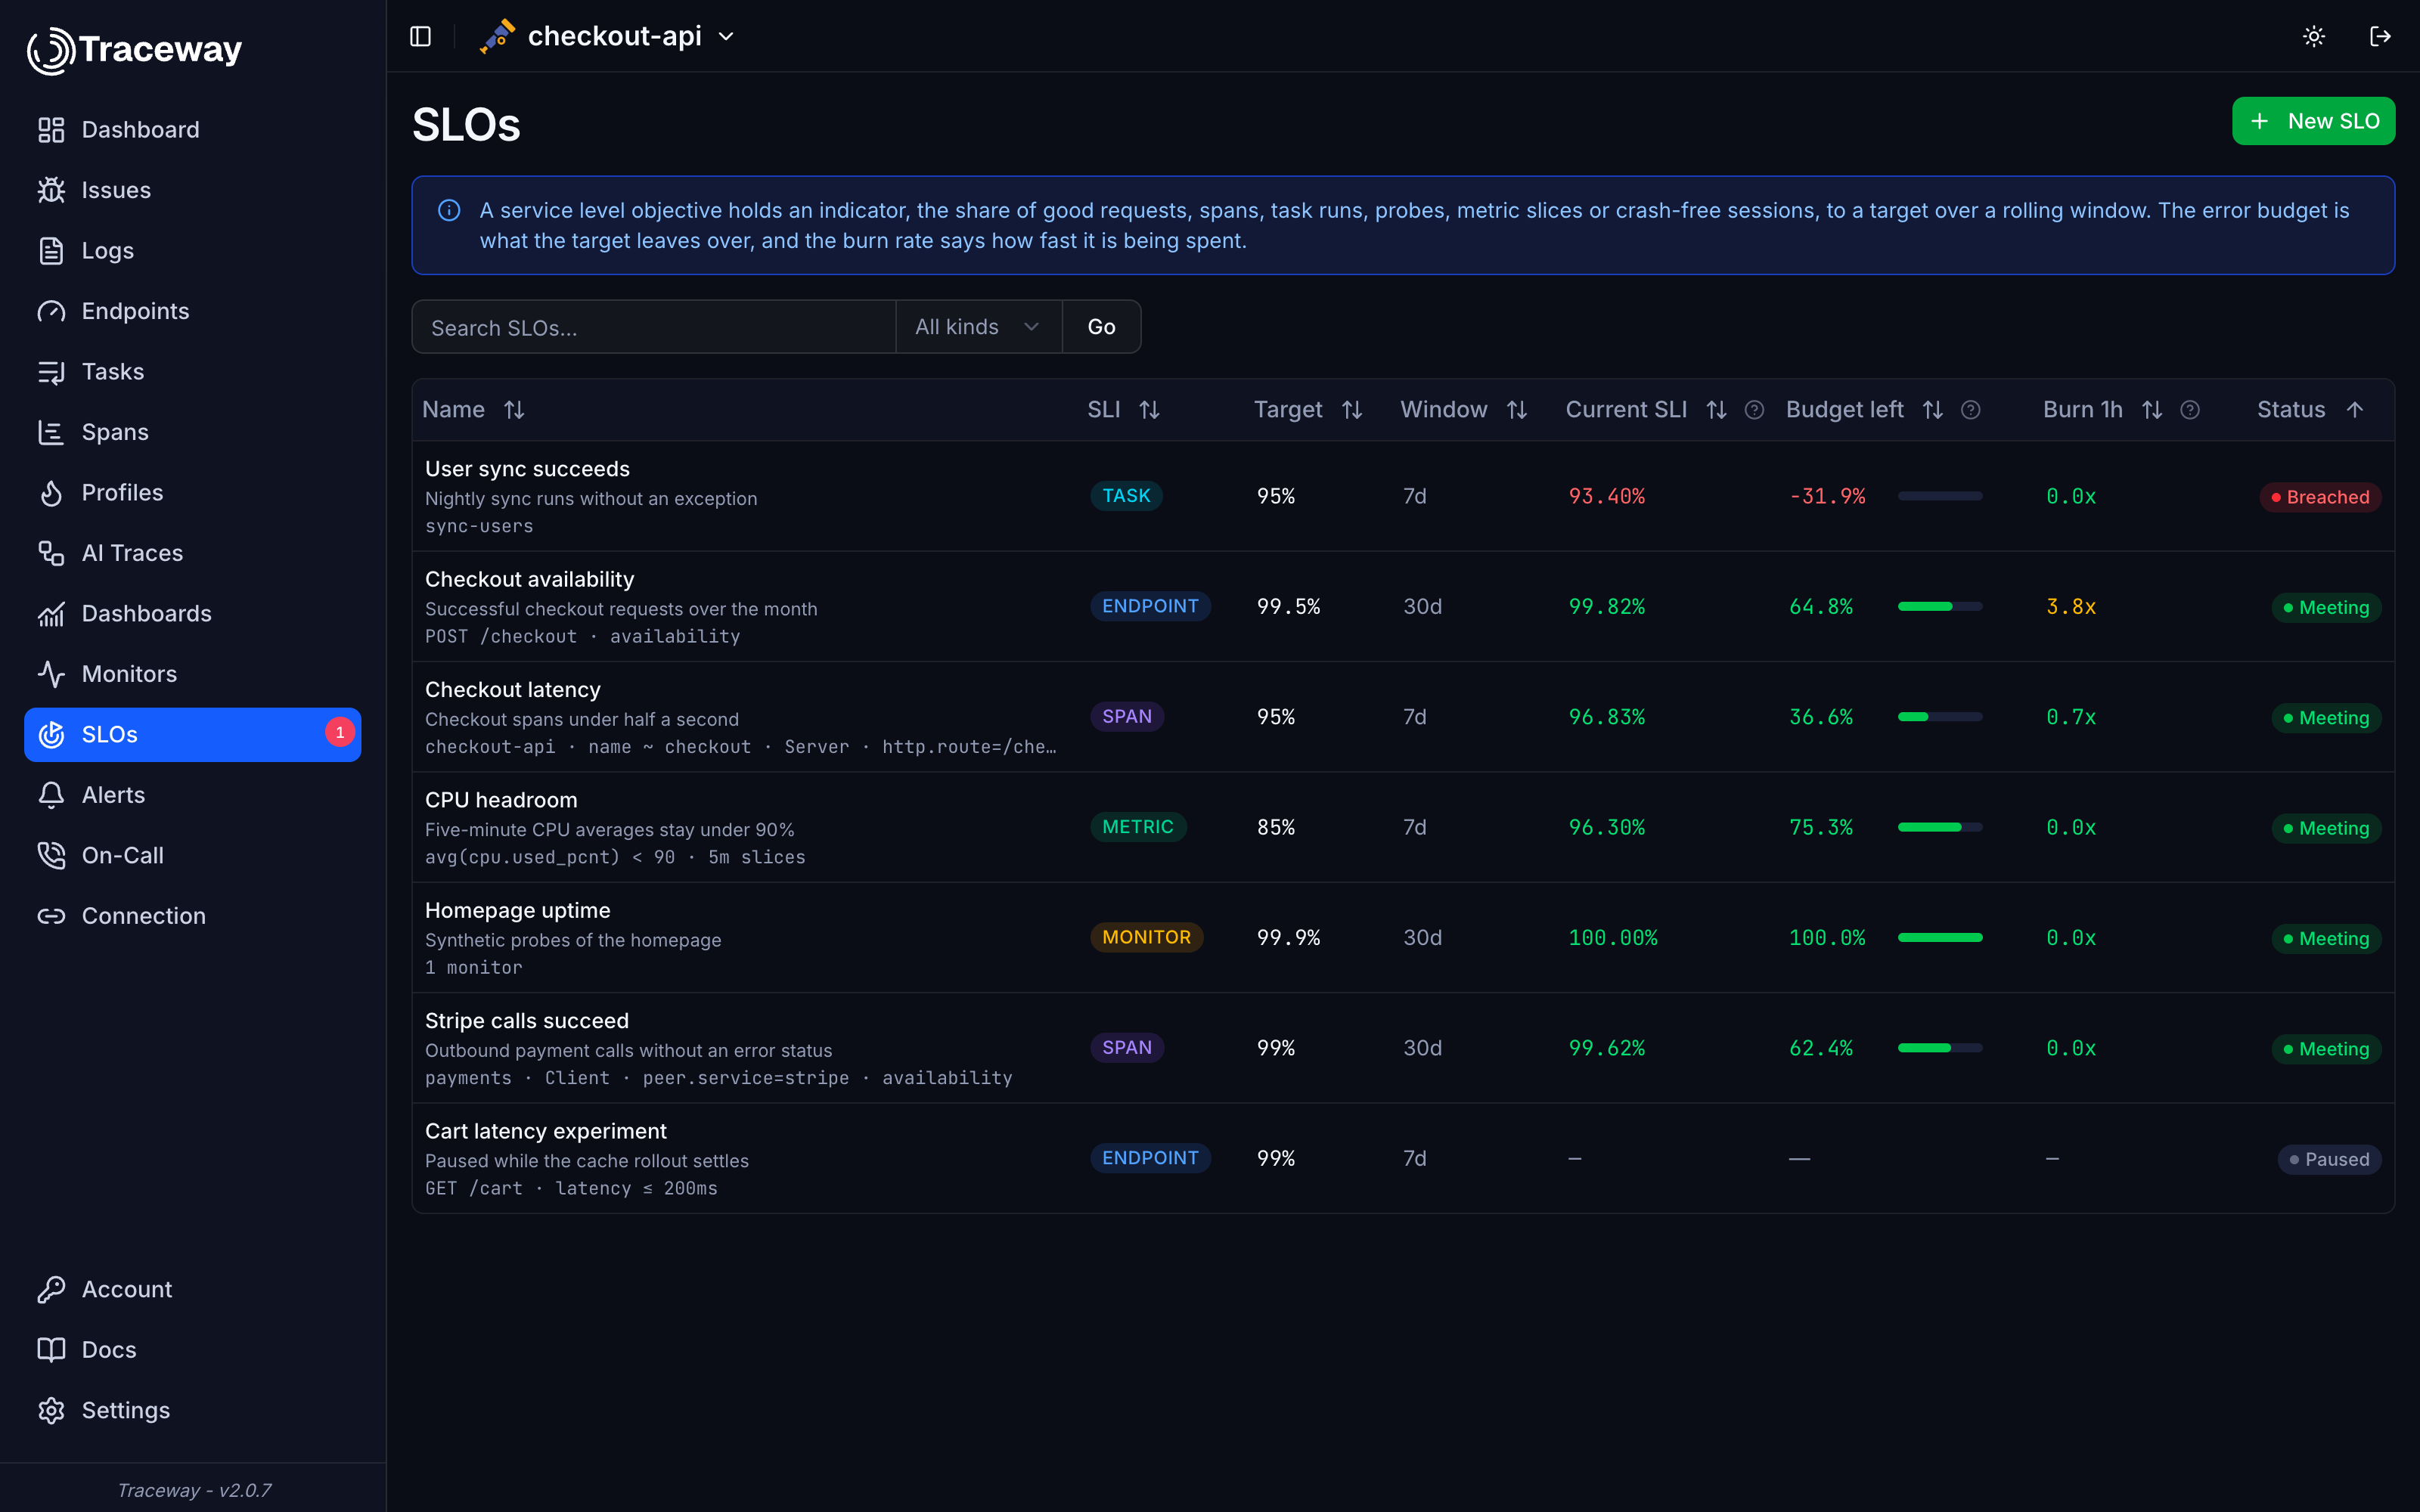
An SLO holds an indicator, the share of good requests, spans, task runs, probes, metric slices or crash-free sessions, to a target over a rolling 7, 30 or 90 day window. What the target leaves over is the error budget, and the burn rate says how fast you are spending it. Traceway computes all of it from the spans, probes, metrics and sessions it already stores, so there is nothing new to instrument.
Endpoints, spans, tasks, monitors, metrics or crash-free sessions
Pick what a good event is and Traceway counts it. An endpoint is good when it answers below 500 or faster than a threshold. A task run is good when no exception landed on its span. A monitor probe is good when it came back up. A metric is cut into slices of 1, 5, 15 or 60 minutes. Each slice is good when its average, minimum, maximum, sum or last value stays on the right side of a limit. Slices without data can count as bad, so a missing heartbeat hurts.
- Availability or latency for endpoints and spans
- Task success from the exception on the run's own span
- Monitor uptime straight from the probe results
- Metric timeslices: over, under, or missing
- Crash-free sessions for browser apps, per app version
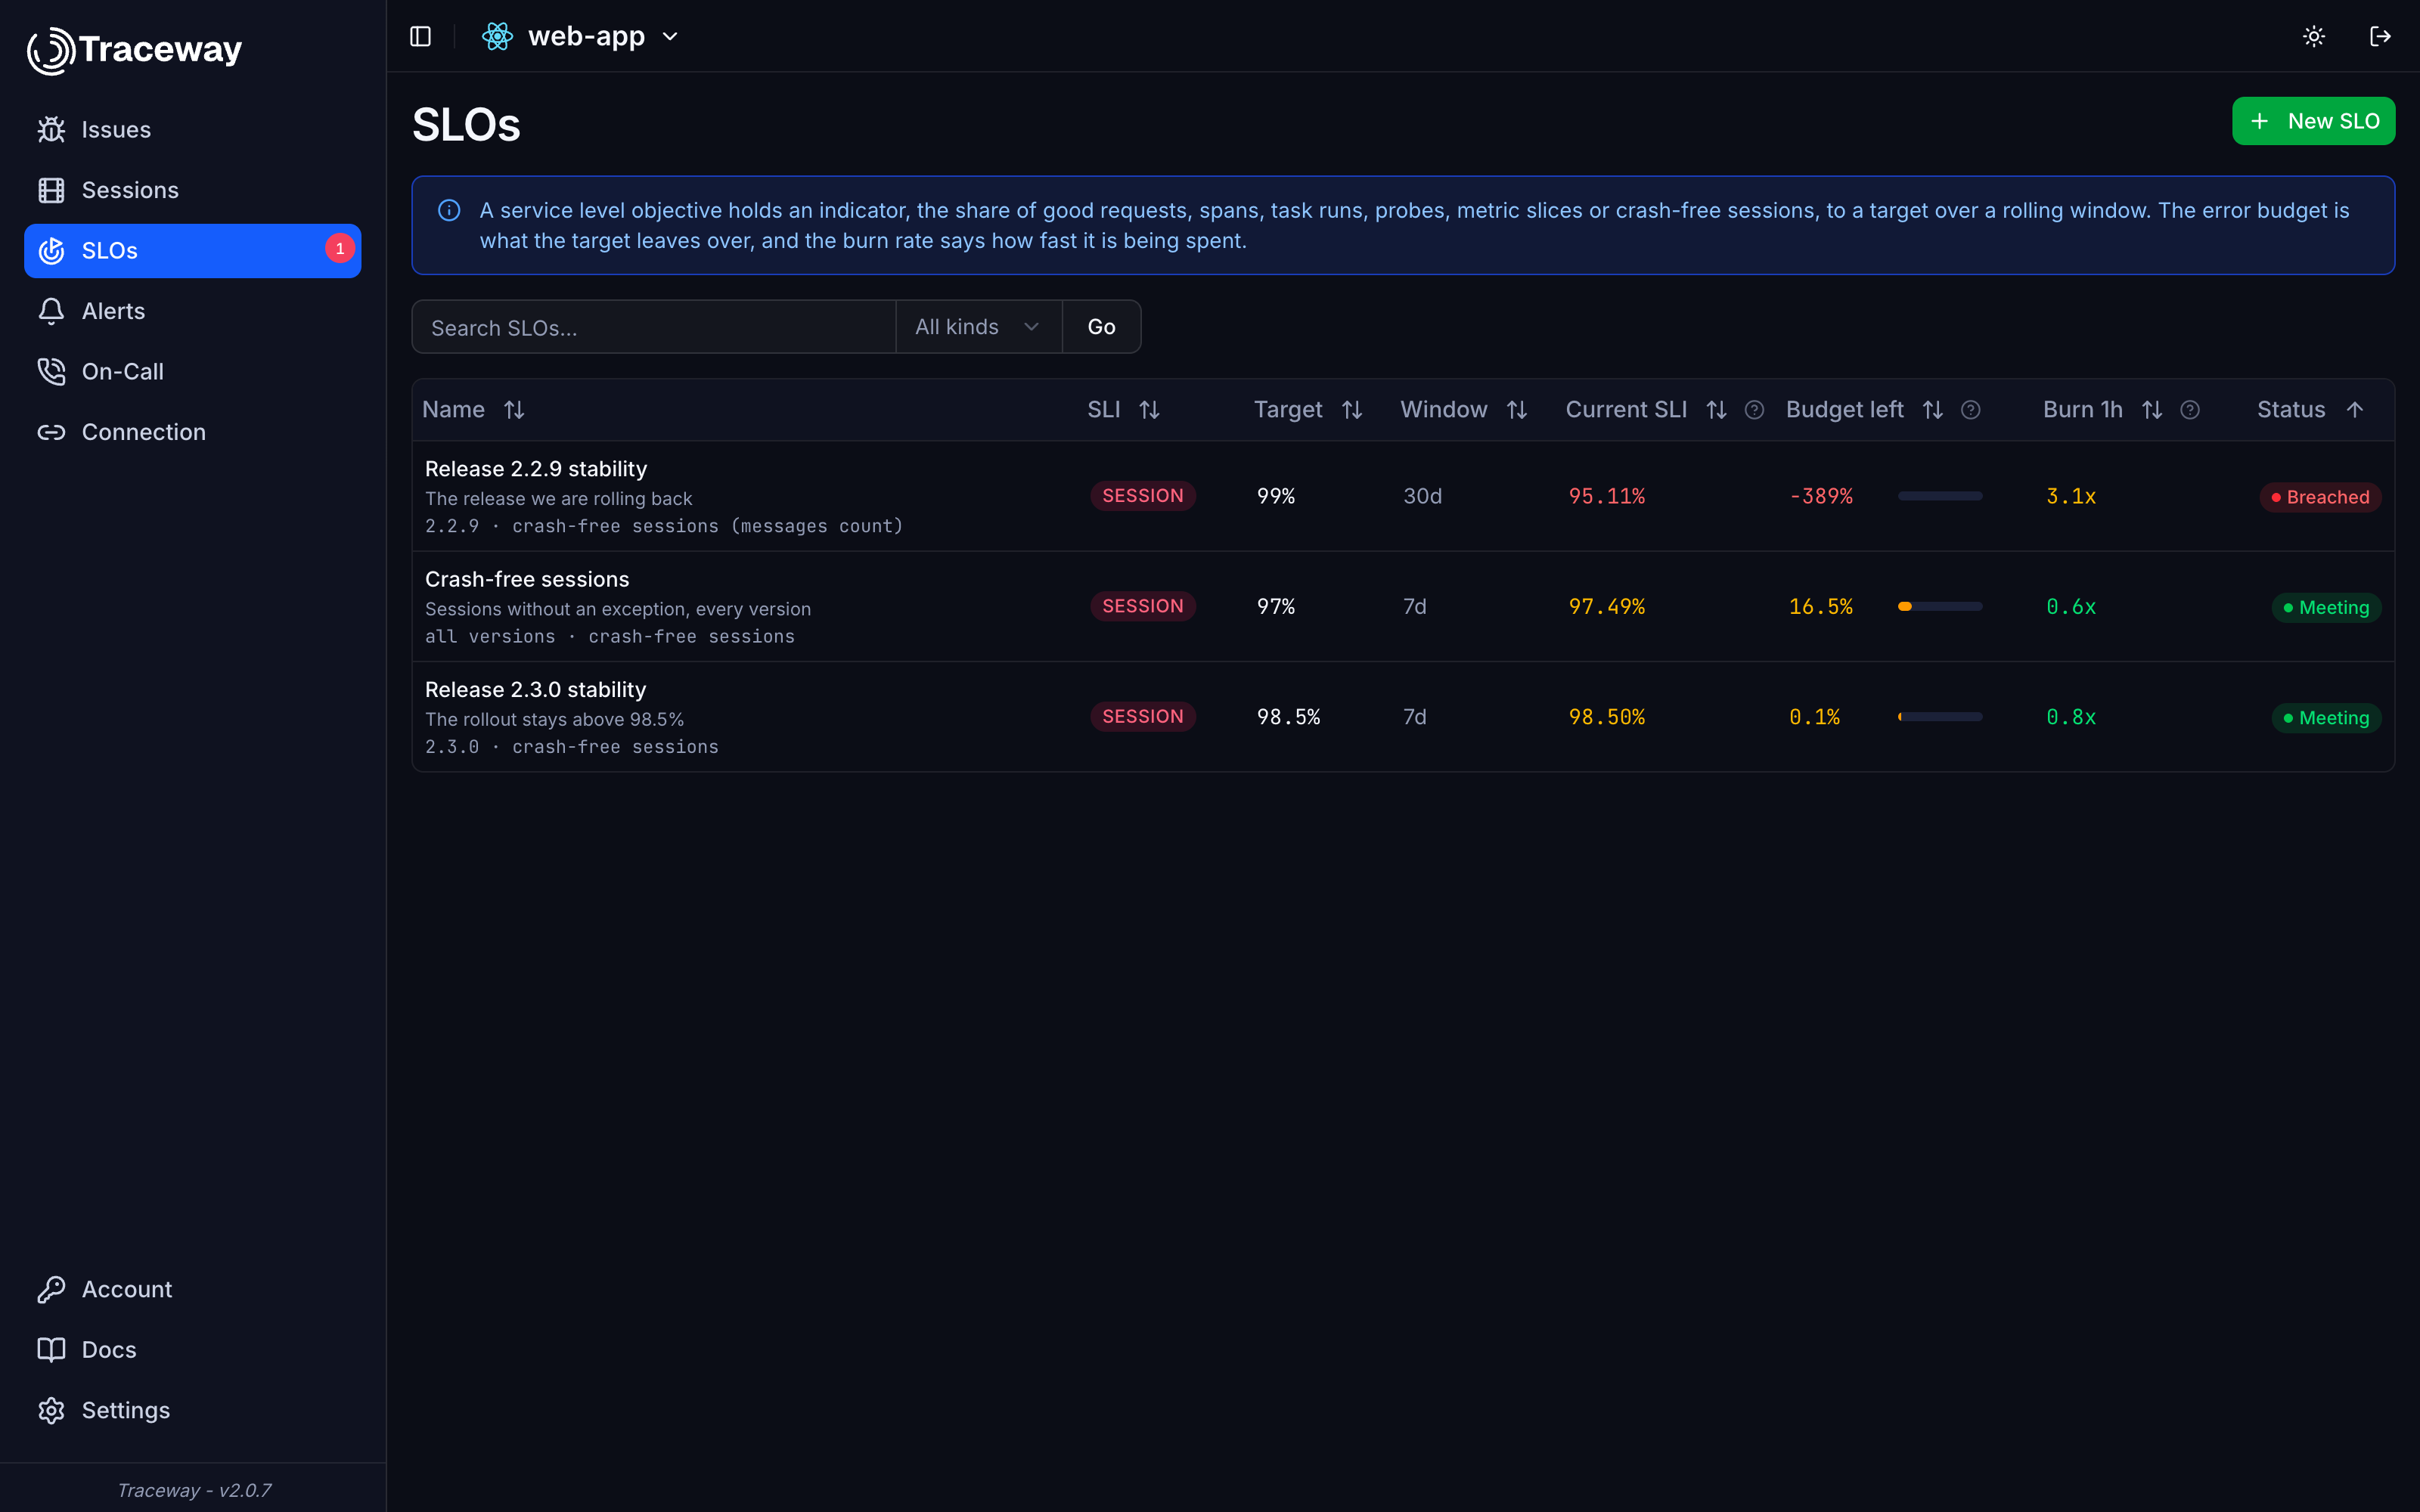
Crash-free sessions, per release
Browser projects get the objective front ends live by: the share of sessions that ended without an exception. Create one per app version and each release gets its own budget, so a release that crashes more than the last one shows up as a breach rather than a hunch. Sessions come from always-on session recording in the browser SDK.
- All versions, or one app version per objective
- Captured messages count only if you say so
- Works for React, Vue, Svelte and jQuery with always-on recording
- Burn-rate and budget alerts like every other objective
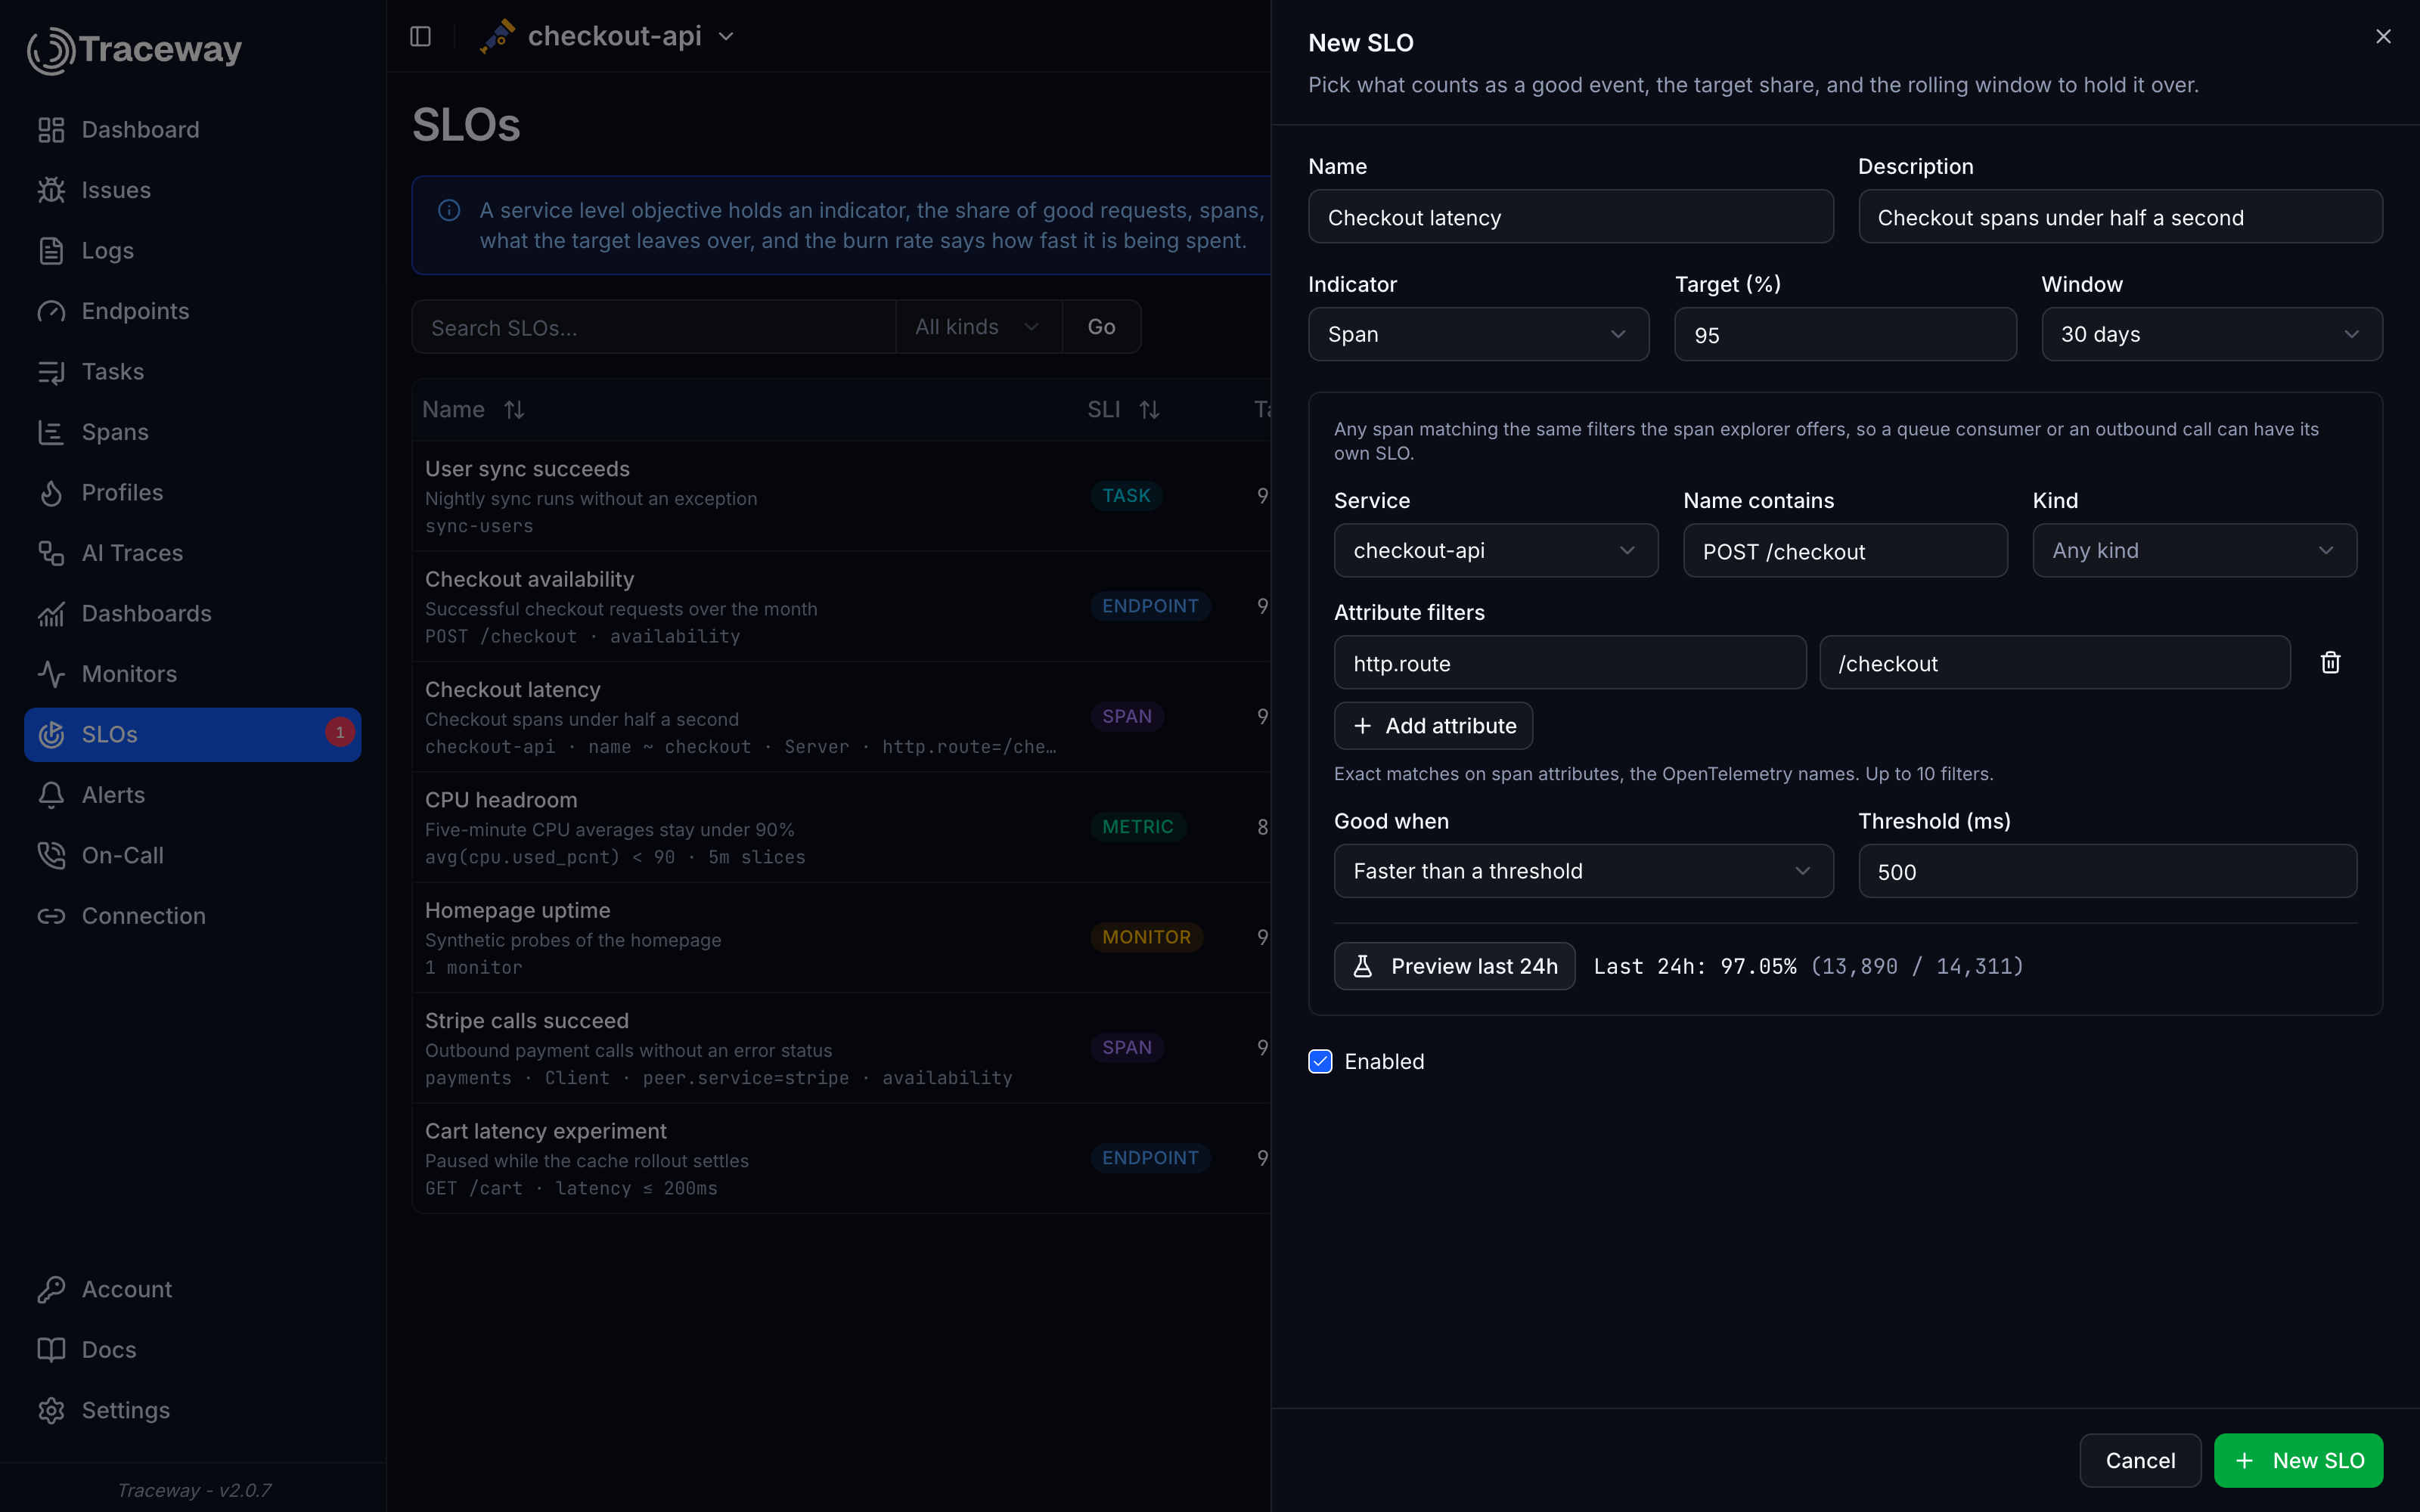
Filter spans the way the explorer does, then hold them to a number
Most SLO products only know services and HTTP routes. A span SLO takes the same filters as the span explorer: service, name, kind, and exact attribute values. A queue consumer, an outbound call to a payment provider, or a GraphQL resolver gets its own objective as long as its spans carry an attribute that identifies it. The Preview button runs the indicator against the last 24 hours before you save, so you see the share of good events and the counts and never guess.
- Service, name, kind and up to ten attribute filters
- Good when the span status is not error, or faster than a threshold
- Preview the last 24 hours before saving
- Works on any OpenTelemetry span, entry point or not
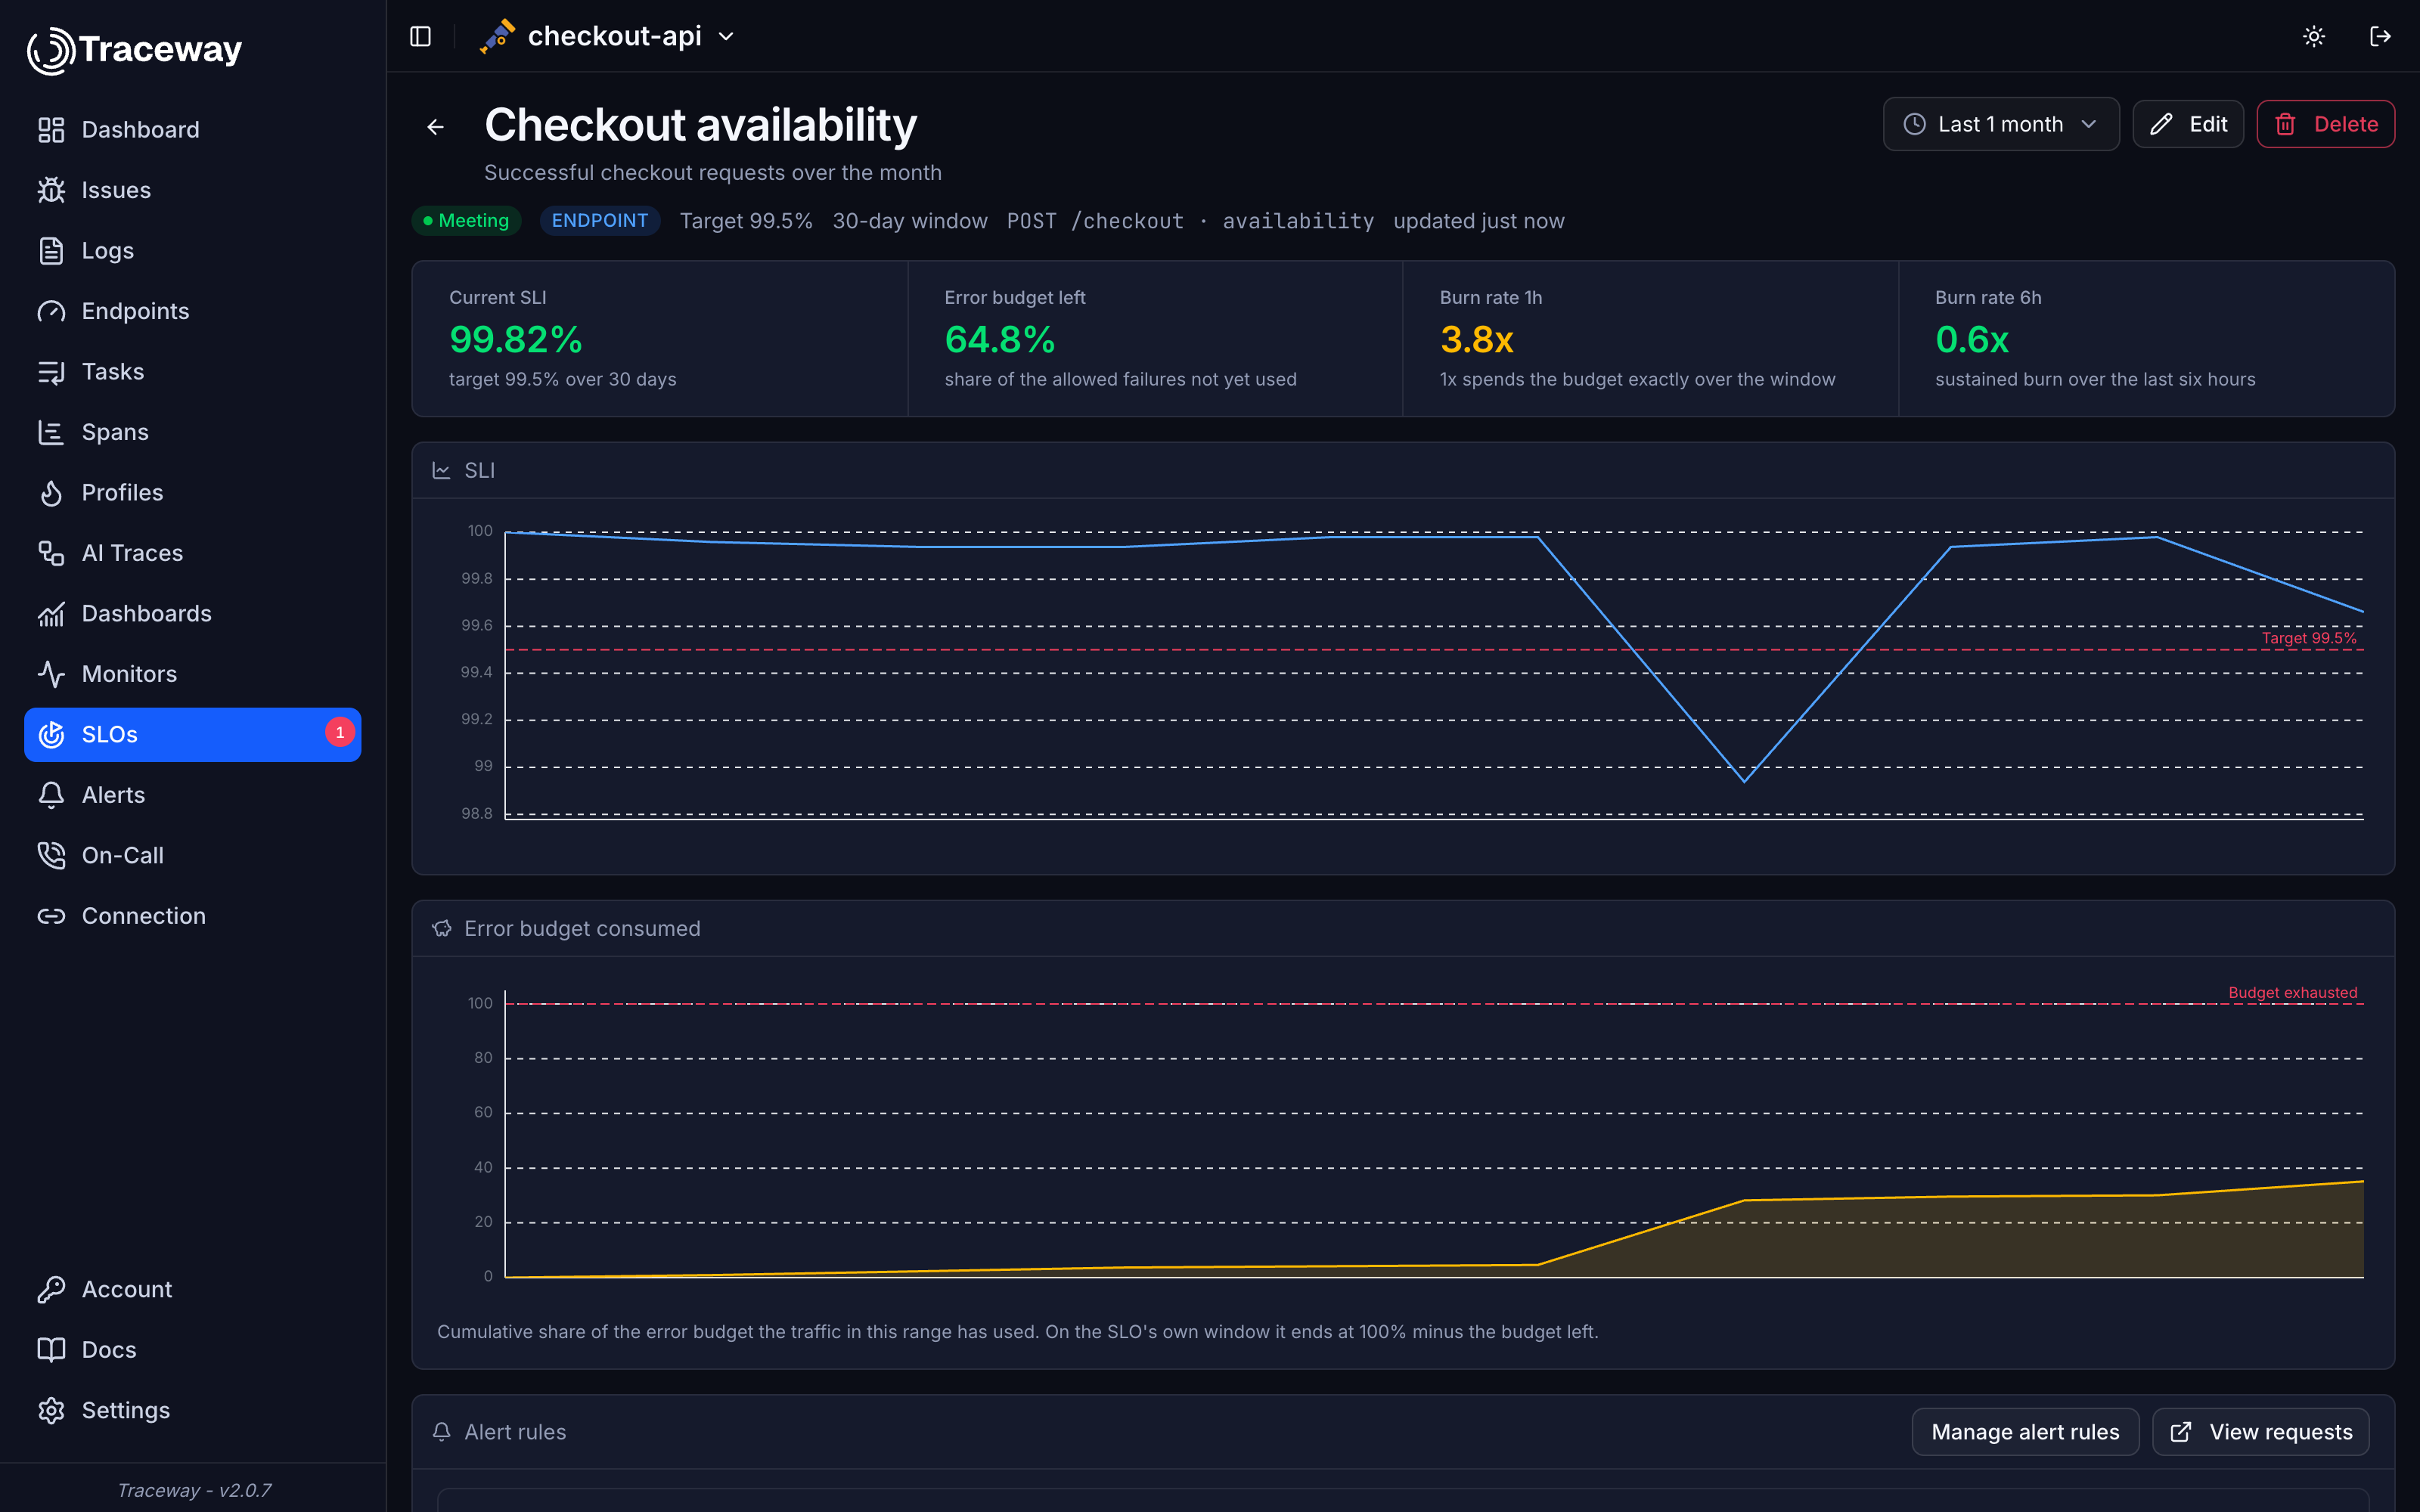
Stop arguing about whether 99.5% is bad
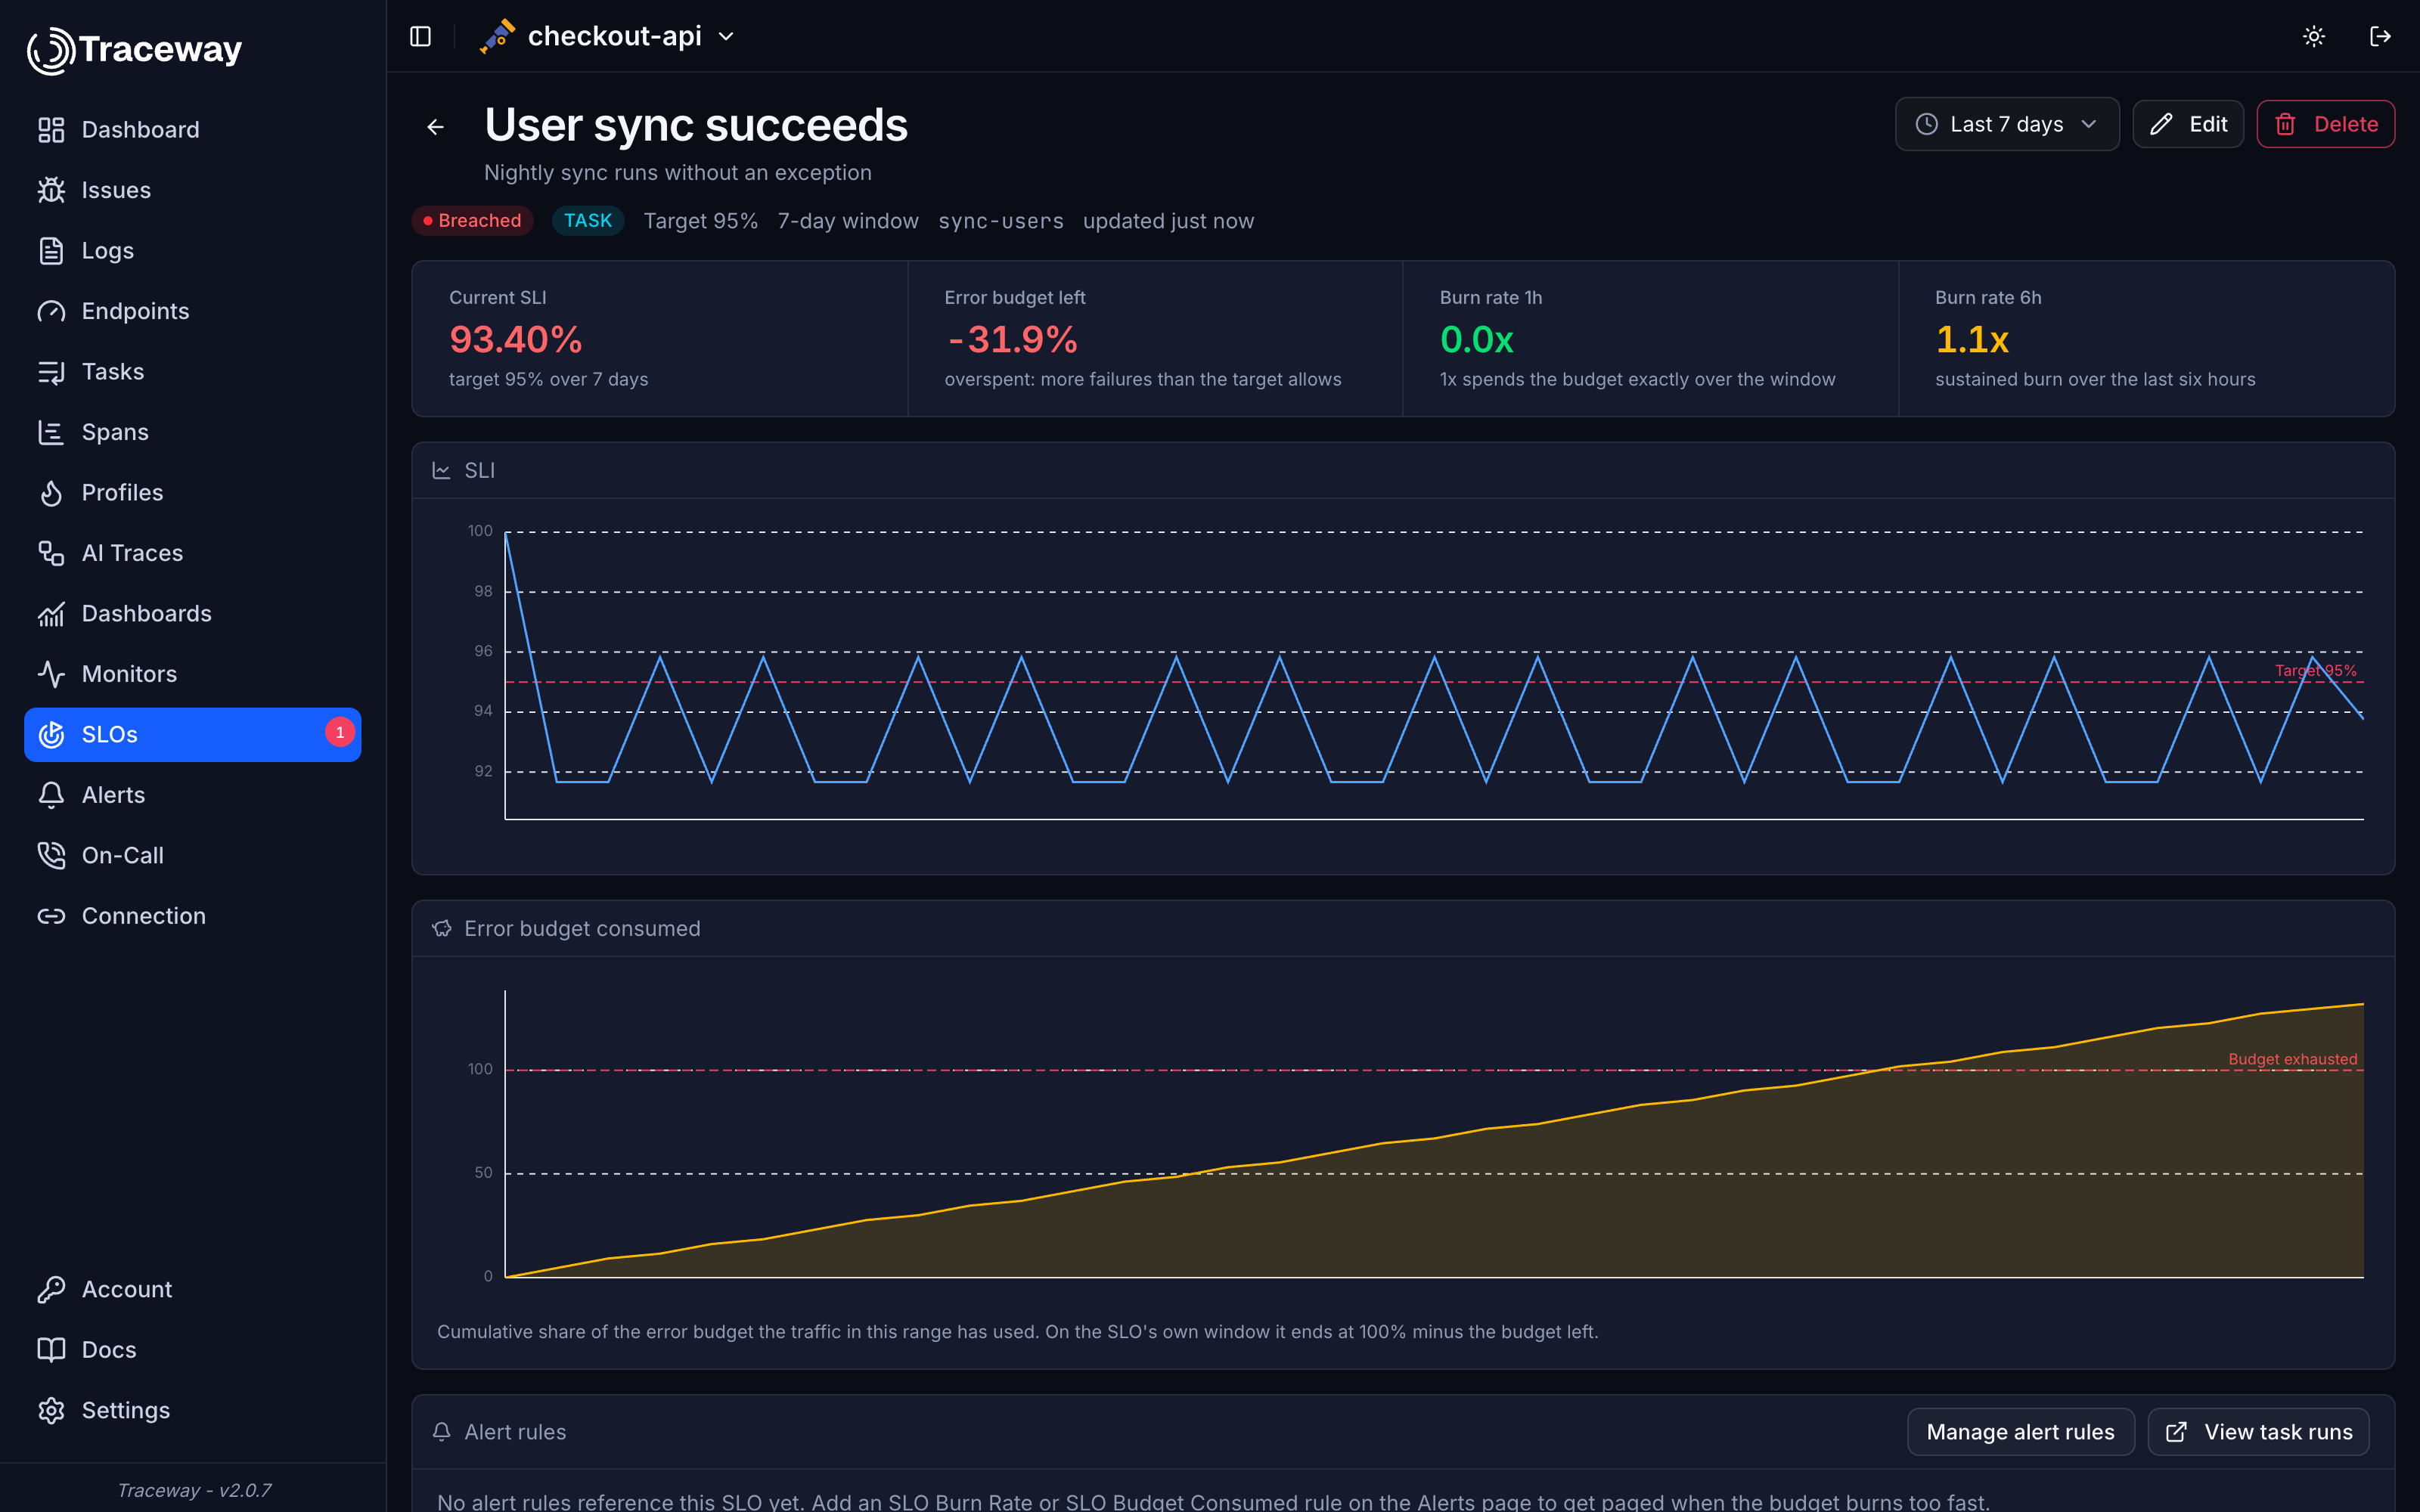
With a 99.9% target over 30 days and a million requests, a thousand may fail. The detail page shows the current SLI against the target, how much of that budget is left, and the burn rate over the last hour and the last six hours: 1x spends the budget exactly at the end of the window, 14.4x empties a 30-day budget in two days. Charts plot the SLI against the target line and the cumulative share of the budget the range has used. One click opens the endpoint, task, monitor or sessions page, or the failing spans in the explorer.
- SLI and error budget charts with the target drawn in
- Burn rates over 1 hour and 6 hours, color coded
- One click to the endpoint, task, monitor or sessions page, or the failing spans
- Rolling 7, 30 or 90 day windows, changed without losing history
Page on fast burns, chat about slow ones, recover on your own
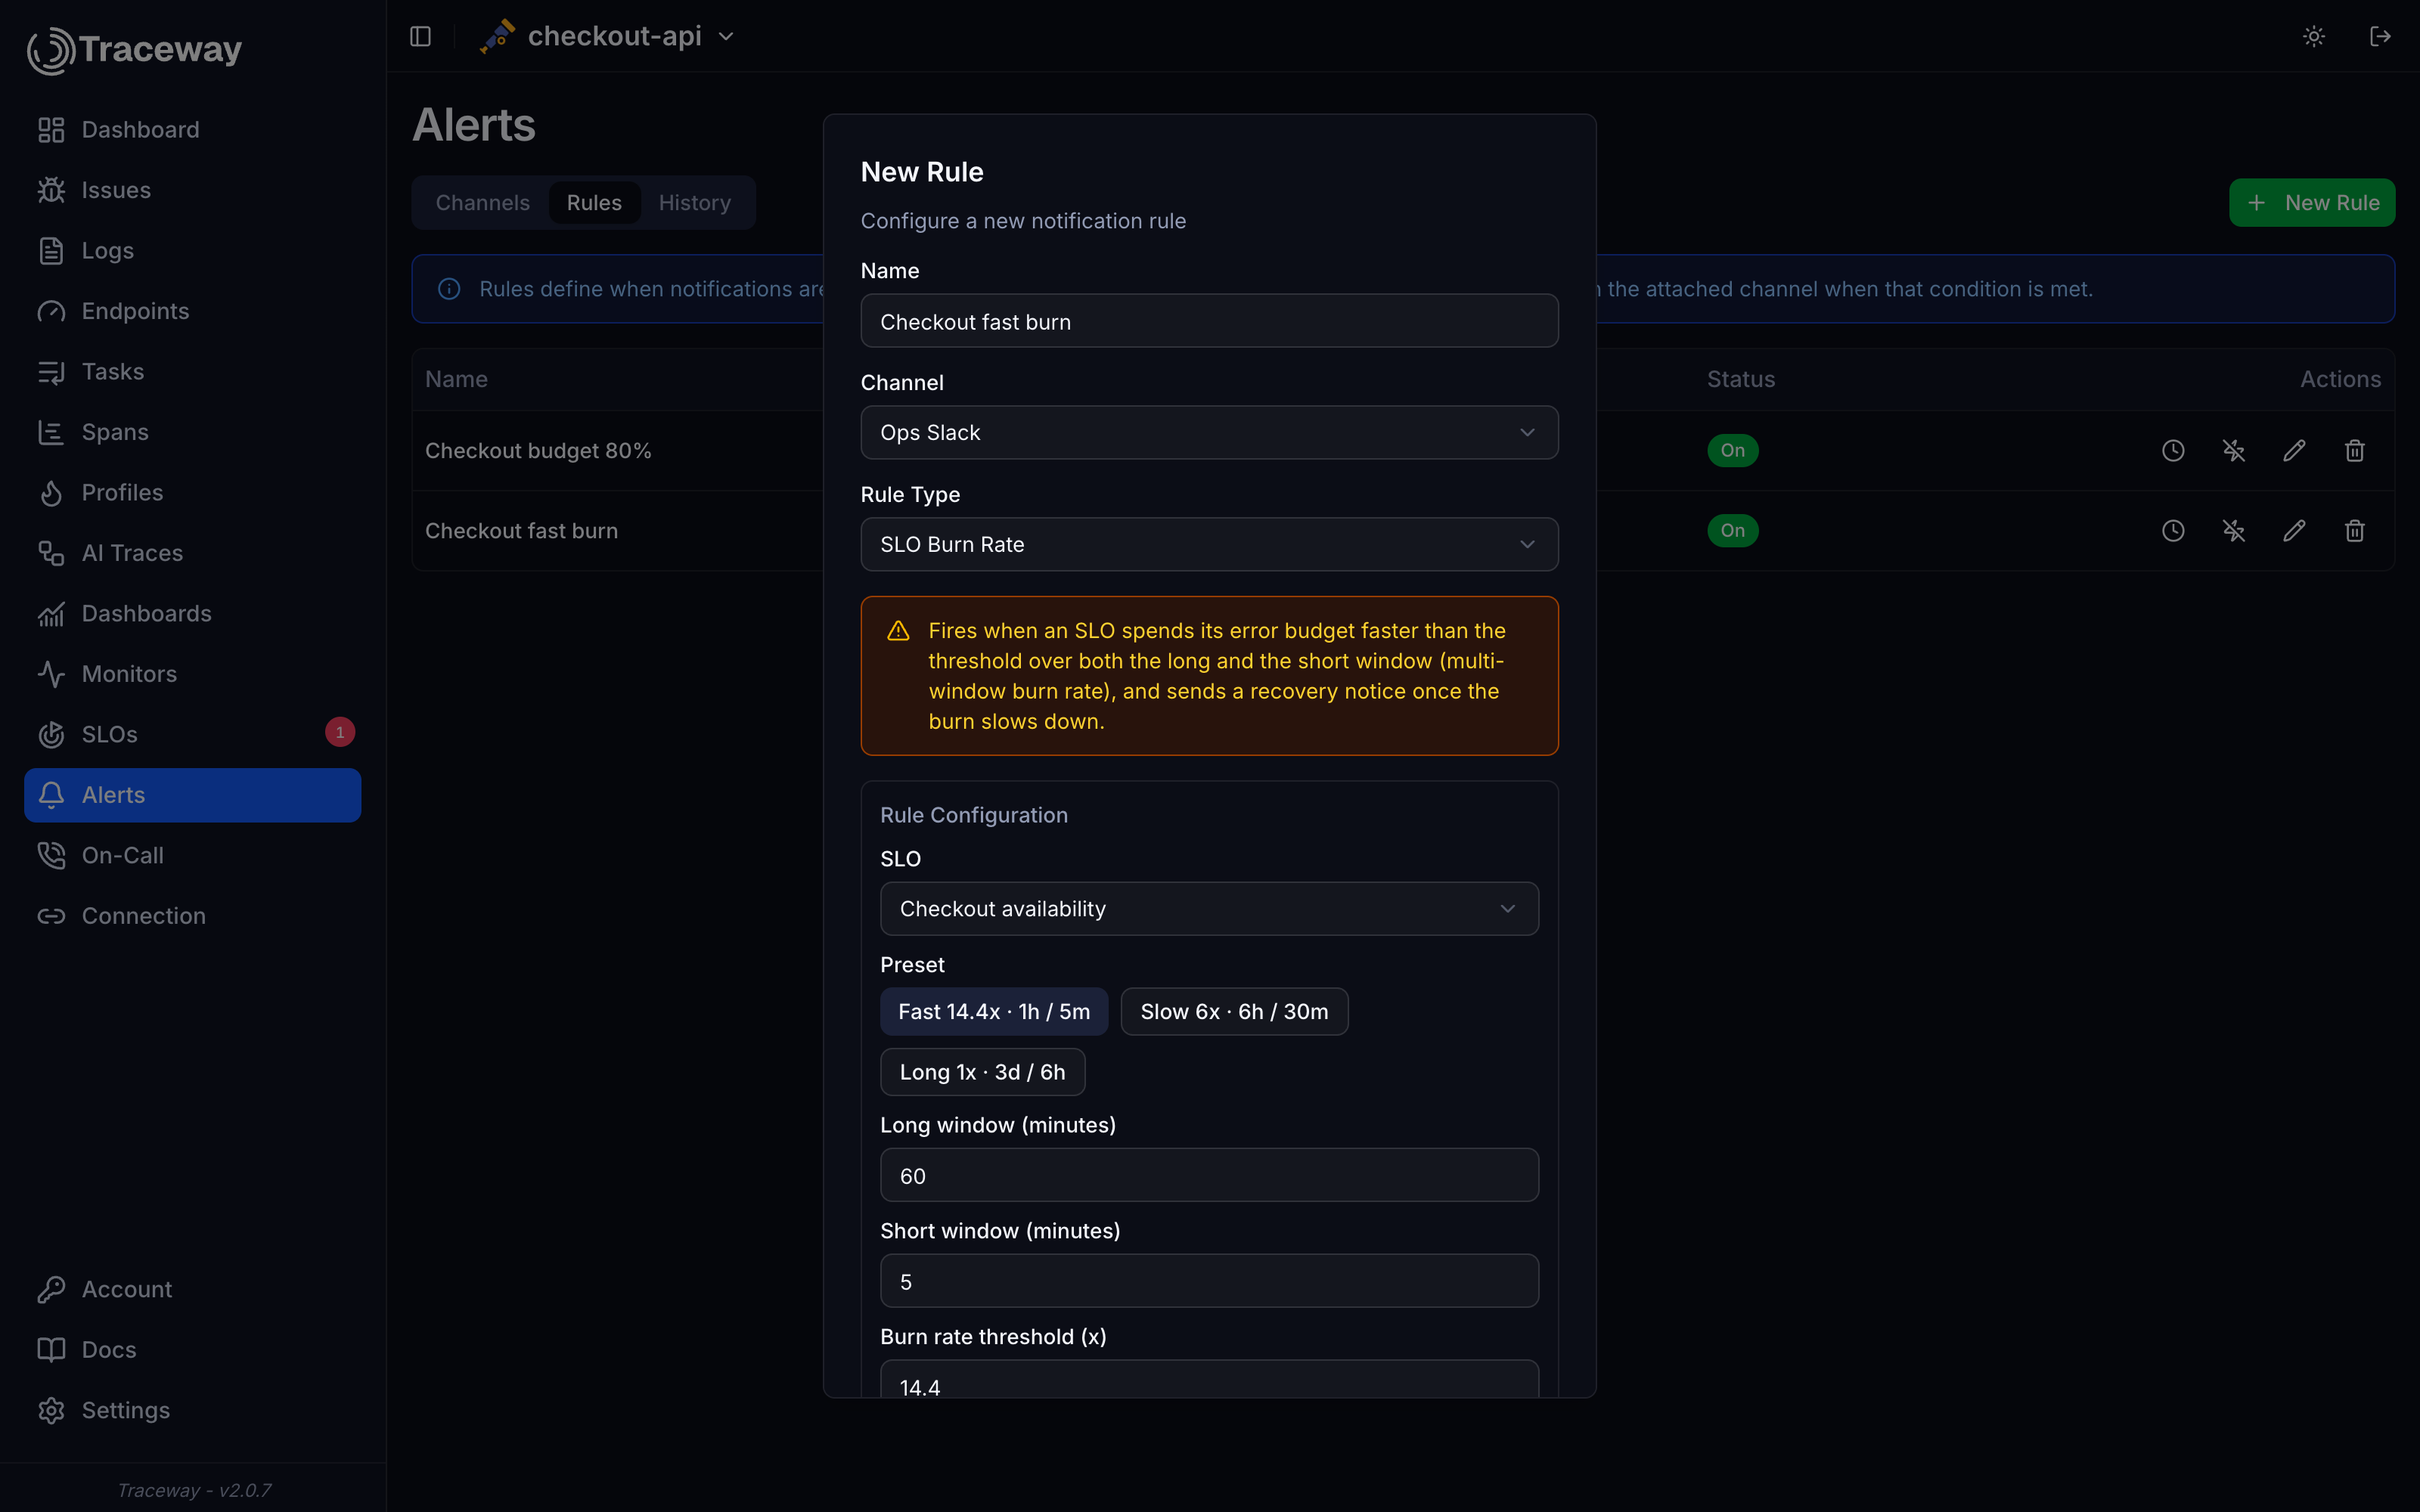
Two alert rules read the SLO: Burn Rate fires when the budget burns faster than a threshold over both a long and a short window, so a one-minute spike never pages and a burn that already ended never pages either. Budget Consumed fires when more than a share of the window's budget is gone. Both fire once on the transition, keep their state across restarts, and send a recovery notice when the condition clears. On an escalation channel the recovery resolves the on-call page itself.
- Google SRE presets: Fast 14.4x over 1h/5m, Slow 6x over 6h/30m, Long 1x over 3d/6h
- Fires on the transition, never re-pages every poll
- Recovery notices, and auto-resolved on-call pages
- Evaluated from precomputed buckets, no raw scans per poll
Buckets, not scans, on SQLite as well as ClickHouse
A background worker folds the raw rows into good/total buckets, one per minute or per metric slice. It refreshes the recent buckets as late data arrives, and backfills the whole window in chunks after you create or change an objective. The SLI, the budget, the burn rates and the alert rules are sums over those buckets. That is what makes a 90-day objective cheap on an embedded SQLite or DuckDB instance, and it means the history survives the pruning of the raw telemetry behind it.
- Per-minute buckets (per slice for metrics) on ClickHouse, SQLite and DuckDB
- Late data within the last hour and a quarter is absorbed, longer for sessions and tasks
- History kept for 120 days whatever the raw retention is
- A breached objective still shows where the budget crossed zero
Objectives in the same tool as the traces that explain them
SLOs, error budgets, burn-rate alerts, on-call and the spans behind every bad event, in one place. Open source if you self-host.
Questions about SLOs
How is an SLO different from an alert rule?
A threshold rule looks at the last few minutes and fires when a number crosses a line. An SLO holds a share of good events to a target over weeks, keeps the history, and turns the gap into a budget. The burn-rate rules then alert on how fast that budget is going rather than on the raw rate, which is what keeps a short spike from paging and a slow leak from going unnoticed.
What is a burn rate?
The observed bad rate divided by the rate the target allows. A burn rate of 1 spends the error budget exactly at the end of the window. 14.4 spends a 30-day budget in about two days, which is why the Fast preset pages at 14.4x over the last hour. A window with no traffic burns nothing.
Which indicators can I build an SLO on?
Endpoint availability or latency, any span filter (service, name, kind, exact attribute values) for availability or latency, task success, monitor uptime, and metric timeslices where each slice is good when its aggregate is over or under a limit. Endpoints and tasks are promoted from spans, so the span kind covers them too. Browser projects get crash-free sessions instead, since their SDK reports sessions and exceptions rather than spans.
What happens to the history when I change an SLO?
Changing the target or the window keeps every bucket, since both are applied on read. Changing what the indicator measures, or the slice length of a metric SLO, recomputes the history from your retained telemetry; the form warns before you save and the detail page says how much of the window is covered while the backfill runs.
Does it work on the SQLite build?
Yes. The worker computes per-minute (or per-slice) buckets on ClickHouse, SQLite and DuckDB alike, and reads sum over buckets rather than scanning raw rows. Buckets are kept for 120 days, so a 90-day objective keeps its history even where the raw telemetry retention is 30 days; what cannot be backfilled is the part of the window older than what is still retained when the SLO is created.
Can an AI agent read my SLOs?
The list, detail, series and breached-count routes are on the agent allowlist, so a read token can call them directly. The CLI and the MCP server do not cover SLOs yet.